6 Charts
6.1 Working with Charts
Charts provide immediate and instinctual tools for apprehending market conditions, analyzing historical performance, and managing your positions.
- Chart Panel .
- Visual Trading
- Showing Multiple Graphs on a Chart
- Changing the Price Scale of a Chart
- Zooming, Scrolling, and Refreshing
- Drawing on Charts
- Using Chart Layouts
- Chart Settings
- Building Indicators
- Buy/Sell Price Tracking
- Cursor Tracking
- Data Window
- Time Scale, Range, and Style
- Charting Historical Data
- Showing and Hiding Layers and Settings
- Volume Chart
6.2 Visual Trading
With visual trading, you can use charts to:
- Place orders by clicking and dragging a price
- Display your positions, orders, events and news as indicators and horizontal lines
- Analyze market data with technical analysis tools
6.2.1 Placing an Order in a Chart
To place an order in a chart:
- Click the Display OE toggle button
 in the top right corner of chart. An Order Entry panel appears in the panel and a red line shows your order price in the chart.

Figure 45: Price Line in Chart when Visual Trading
- Enter the details of your order in the Order Entry panel.
- Place your order clicking the sell or buy price in the Order Entry panel.
Your order is placed and a horizontal line shows your order in the chart.
To close the Order Entry panel in the chart without placing an order, click the Trade button again.
6.2.2 Visual Positions
Your positions are displayed in the Trading Layer of a chart.
To display your open positions on the chart, you should configure the Trading Layer of the chart to show positions. see Chart Settings. You can then right-click inside the chart and select View > Trading Layer or click the Hide/Show Trading Layer button:
![]()
Any position in the instrument of the chart displays on the chart as a solid horizontal orange (SELL positions) or green (BUY positions) line crossing the price axis at the position's price. You can change the color of the lines. A dot on the line indicates the time when the position was opened.

Figure 46: Position Tooltip
TIP: You may need to zoom out or scroll vertically to see your visual positions, orders, events, or news (see Zooming, Scrolling, and Refreshing).

Figure 47: Position Highlighted in Chart with Open Context Menu
The figure above shows a sell position. When you hold the mouse over the line, a tip appears showing the details of the position. Right-click the line to display a shortcut menu you can use to close the position (Closing a Position), close a part of the position (Closing a Position Partially), or set a stop loss or take profit price (Using Stop Loss and Take Profit Prices). Double-click the line to directly close the position (Closing a Position) or close a part of the position (Closing a Position Partially).
6.2.3 Visual Orders
Your orders are displayed in the Trading Layer of a chart.
To display your pending orders on the chart, you should configure the Trading Layer of the chart to show orders. see Chart Settings. You can then right-click inside the chart and select View > Trading Layer or click the Hide/Show Trading Layer button:
![]()
Click an order's line to display a shortcut menu you can use to modify the order (Modifying a Pending Order), cancel the order (Canceling Pending Orders), or set a stop loss/take profit price (Using Stop Loss and Take Profit Prices).
6.2.4 Events and News
Events (such as trade execution) and news are displayed in the Trading Layer of a chart as up/down arrows.
To display events and news on the chart, you should configure the Trading Layer of the chart to show these items. see Chart Settings. You can then right-click inside the chart and select View > Trading Layer or click the Hide/Show Trading Layer button:
![]()
News is recorded in a chart at the time it entered the system.
Mouse over the event or news arrow to see a tooltip with the event or the news headline. To read the entire news item, double click the arrow.

Figure 48: Event Marker with Tooltip
6.2.5 Changing Colors and Line Styles
To customize colors and line styles, select Chart > Settings from the menu or click the Show Settings button in the chart panel:
![]()
see Chart Settings for more information.
6.3 Showing Multiple Graphs on a Chart
You can show more than one graph in a Chart panel and switch between them to analyze the market and trade.
To show multiple graphs on a chart:
- Click the New symbol button in the top left of the Chart panel.
An Instrument Lookup window opens.
- Click the symbol that you want to add and click OK or simply double-click the symbol.
The graph and data window for the new symbol is added to the chart. The new graph is added underneath the active chart symbol and appears faded.
To bring a symbol's graph forward and view it temporarily, place your mouse cursor over the symbol at the top of the panel. When you move your mouse cursor off the symbol, the graph fades and returns to the background.
To bring a symbol's graph to foreground as the active graph, click the symbol at the top of the panel. You can now enter orders and use cursor following on the graph.
The following image shows the Chart panel with graphs for four symbols. The currently active symbol is EUR/USD as indicated by the pushpin icon and dotted line at the top of the chart.
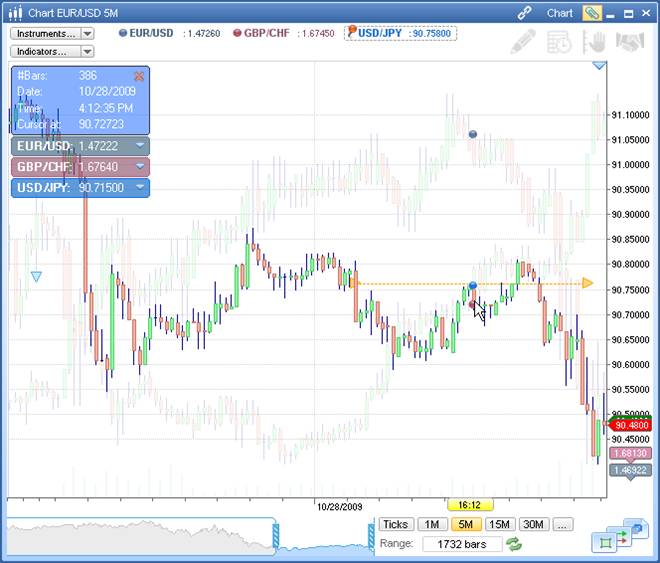
Figure 49: Chart Panel with Four Graphs
6.4 Changing the Price Scale of a Chart
You can configure how the scale of a chart is calculated and displayed, either as an absolute value or as a relative value taken from the chart data.
Relative scales allow you to quickly view the behavior of the market over an extended period of time during a day.
To change how the scale of a chart is determined:
- Right-click the chart and select View > Relative Price Scale from the context menu.
The Price scale settings window opens.
- Click the radio button of the method you want to use to calculate the scale:
- Absolute values: The absolute scale of the currently active symbol
- Begin of the screen: The first visible bar in the chart. Price values are displayed as a relative percentage from that first bar.
- Begin of the data: The first value for the data in the chart. Price values are displayed as a relative percentage from that value.
- Begin of the day: The first value at the start of the current day. Price values are displayed as a relative percentage from that first value.
- Custom value: Enter your own value to use as a basis for scale calculations and display.
- Click OK.
The graphs in the chart redraw according to the scale you have chosen.
The Price Scale button changes to show the value that is currently being used to determine the scale of the graphs.
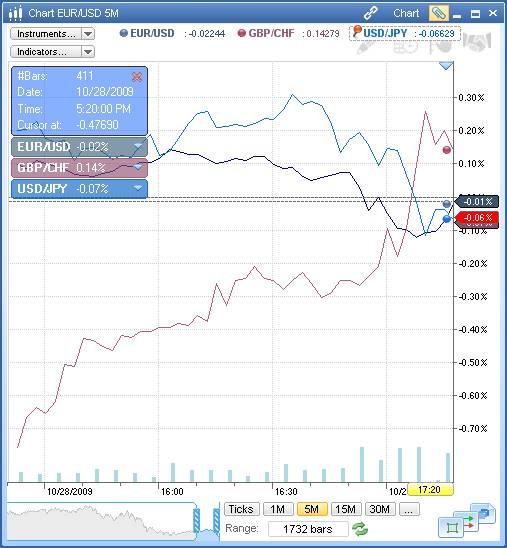
Figure 50: Chart Showing Graphs with Relative Scale
6.5 Zooming, Scrolling, and Refreshing
You can zoom in and out on the chart, scroll horizontally (by time) or vertically (by price), change the bar width, offset the chart, and manually refresh the chart.
6.5.1 Time Zooming (Horizontal)
To zoom in and out on the chart by time, click and drag the sliders ![]() at either end of the chart's scroll bar.
at either end of the chart's scroll bar.

Figure 51: Chart Scroll Bar with Sliders
To show all data in the chart, double-click the chart's scroll bar or the horizontal (time) axis.
You can also specify the number of time periods the chart covers by right-clicking inside the chart and choosing View > Periods. In the dialog box that appears, enter the desired number of periods and click OK.
6.5.2 Price Zooming (Vertical)
To zoom in and out of on the chart by price, click and drag up and down on the vertical (price) axis. Your mouse pointer changes to arrows ![]() to indicate that you are zooming the chart.
to indicate that you are zooming the chart.
When you zoom by price, automatic vertical scrolling is turned off. To turn automatic vertical scrolling back on, click the Use Manual Zoom toggle button ![]() on the chart or the Auto button
on the chart or the Auto button ![]() in the Chart ribbon.
in the Chart ribbon.
6.5.3 Scrolling the Chart
To scroll the chart horizontally, click and drag between the scroll bar sliders ![]() at the bottom of the Chart panel, or click inside the chart and drag to scroll back and forth.
at the bottom of the Chart panel, or click inside the chart and drag to scroll back and forth.
When scrolling through historical data in the chart, you can return the chart to the current time and enable automatic vertical scrolling by clicking the arrow button ![]() in the lower right corner of the chart.
in the lower right corner of the chart.
By default, the chart scrolls automatically in the vertical axis to keep the current prices in view. To use manual vertical scrolling, click the Use Manual Zoom toggle button ![]() on the chart or the Manual button
on the chart or the Manual button ![]() in the Chart ribbon to enable manual scroll. Now you can scroll the chart vertically by clicking inside it and dragging up and down. To restore automatic vertical scrolling, click the Use Manual Zoom toggle button
in the Chart ribbon to enable manual scroll. Now you can scroll the chart vertically by clicking inside it and dragging up and down. To restore automatic vertical scrolling, click the Use Manual Zoom toggle button ![]() again or the Auto button
again or the Auto button ![]() in the Chart ribbon.
in the Chart ribbon.
6.5.4 Offsetting the Chart to the Left
To offset the chart to the left by a specified number of bars or percentage, right-click inside the chart and select View > Bars to right.... In the dialog box that appears, enter the desired offset in bars or percentage and click OK. You can also click and drag the offset arrow ![]() at the top of the vertical (price) axis.
at the top of the vertical (price) axis.
6.5.5 Refreshing the Chart
Charts are refreshed automatically. If you need to refresh the chart manually, click the Refresh ![]() button in the lower right corner of the chart to reload and redraw the chart data from the server.
button in the lower right corner of the chart to reload and redraw the chart data from the server.
6.6 Drawing on Charts
A set of graphic tools is available to help you analyze price movements.
You can access drawing tools in the following ways:
- Right-click the chart and select a drawing tool from the Tools menu.
- Click the Display Drawing Toolbar button (
 ) to open a window of drawing tools in the chart:

Figure 52: Drawing Toolbar
When you choose a tool, further tool properties, if any, display in the toolbar.
The following table lists the graphic tools and their corresponding toolbar buttons.
Button |
Graphic Tool |
|
Default mouse pointer |
|
Selection tool for selecting multiple drawing objects |
|
Eraser tool for erasing drawing objects in the chart |
|
Line |
|
Horizontal Line |
|
Vertical Line |
|
Fibonacci Time Zone |
|
Fibonacci Expansion |
|
Fibonacci Retracement |
|
Fibonacci Time Goal Analysis |
|
Fibonacci Arc |
|
Fibonacci Fans |
|
Fibonacci phi-Channel |
|
Fibonacci Spiral |
|
Andrew's Pitchfork |
|
Polygon |
|
Add Text |
|
Add Symbol |
To use a tool:
- Right-click inside the chart and select Tools > [desired tool] or click the appropriate icon on the Drawing toolbar.
- If the tool requires points to be specified on the chart (for example, Line requires two points while Andrew's Pitchfork requires three), you will also need to choose if you will Stick to close, Stick to open, Stick to high or Stick to low. This defines to which price type you will snap when specifying points.
- Click the point on the chart to start drawing.
6.6.1 Defining Graphics Appearance
Click a graphics object and select Properties to bring up the Settings dialog box. Use this dialog box to define the sticking mode, color, line style and width, background color, and so on.
The settings can be reset to default by clicking the Use Default button. Conversely, current settings can be made defaults by clicking the Save As Default button. The default settings will apply to all new graphics.
6.6.2 Moving and Reshaping Graphics
To move or reshape a graphic object you have drawn, hold your mouse over it to see the pointer change to four arrows and handles appear on the object. To move the object, hold the pointer over a handle-free spot on the object and drag the object to the new location. To move multiple objects, use the Selection tool to select the objects you want to move. To reshape the object, hold the pointer over one of the handles and drag.
6.6.3 Copying Graphics
To copy an object, right-click the object and select Clone. A copy of the object will appear beside it.
6.6.4 Hiding and Displaying Graphics
To hide all graphics temporarily, click the Show/Hide Tool Layer toggle button. see Showing and Hiding Layers and Settings for more information.
![]()
Figure 53: Show/Hide Tool Layer (Highlighted)
6.6.5 Deleting Graphics
To delete a single graphics object, click it and choose Delete or use the Eraser tool. To delete multiple graphics, use the Selection tool to select the graphics you want to delete and then click the Eraser tool. To delete all graphics, right-click the chart and choose Tools > Remove All.
6.7 Using Chart Layouts
A chart layout stores the chart's time scale and style, magnification, bar width, and offset (see Zooming, Scrolling, and Refreshing), cursor tracking (see Cursor Tracking), data window (see Data Window), volume chart (see Volume Chart), and other settings (see Chart Settings) as well as any visual trading settings (see Visual Trading), and indicators (see Building Indicators). You can save a chart layout and then apply it to another chart. Layouts are saved in chart template (.ctp) files.
To save the current chart layout to a file:
- Right-click inside the chart and select Layout > Save. This brings up the Save Template to File dialog box.
- Browse to the folder where you want to place the template file.
- Enter a name for the template file.
- Click Save.
To load the saved chart layout from a file and apply it to a chart, right-click inside the chart and select Layout > Load. In the Load Template from File dialog box, locate and select your .ctp file and click Open.
To return to the standard chart layout, right-click inside the chart and select Layout > Load Default. A customized chart layout can also be set as default by right-clicking and selecting Layout > Set as Default. You may want to save the standard chart layout in a separate file before changing the defaults.
6.8 Chart Settings
You manage chart settings as separate visible layers:
- Visual Trading Layer: Your trades, positions, and orders
- Main Layer: Graphical representation of prices, volume, textual price information, and cursor position
- Tool Layer: Drawing, notation, and indicators
The Chart Settings panel displays these layers as small example screens in the panel. Click the small screens to switch between layer settings.
You can save all of your chart settings to a chart layout file (see Using Chart Layouts).
To view and change chart window settings, right-click inside the chart and select BNFX Button > Settings or click the Show Settings button in the lower right corner of the chart:
![]()
This opens the chart settings in the chart panel:
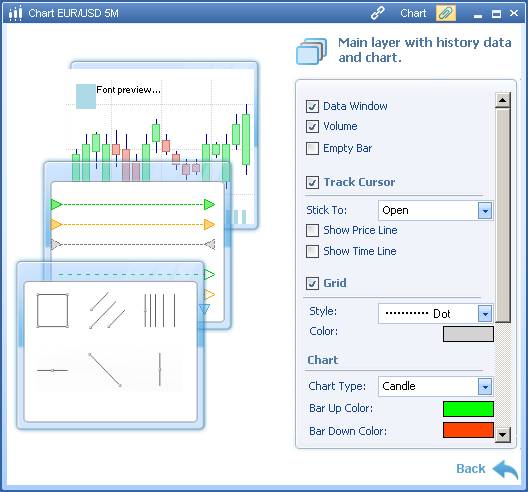
Figure 54: Chart Settings
6.8.1 Main Layer Settings
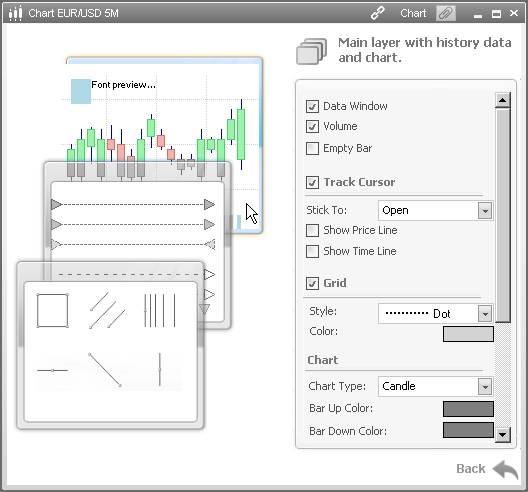
Figure 55: Main Layer Settings
- Data Window: Toggles the Data Window visibility on and off. see Data Window for more information.
- Volume: Toggles the visibility of the volume bars along the horizontal axis of the chart. see Volume Chart for more information.
- Empty Bar:
- Track Cursor: Toggle cursor tracking. see Track Cursor Settings and Cursor Tracking for more information.
- Grid: Specifies the visibility and appearance of the grid in the chart. Check and uncheck the checkbox to show or hide the grid. Choose a line style from the Style drop-down list. To choose the color of the grid lines , click the Color box and choose the new color from the dialog.
- Chart: Choose the chart type and colors. see Chart Types and Colors for more information.
- Text: Specifies the font and color of the text along the vertical (price) and horizontal (time) axes. To choose another font, click the ... button and choose the new font from the dialog. To choose another color, click inside the Color cell and choose the new color from the dialog.
- Background: Specifies the background colors of the chart background gradient. The Top Color sets the top color and Bottom Color sets the bottom color. To choose another color, click the color box and choose the new color from the drop-down list.
When you finish, click Back to return to your chart.
6.8.2 Visual Trading Layer Settings
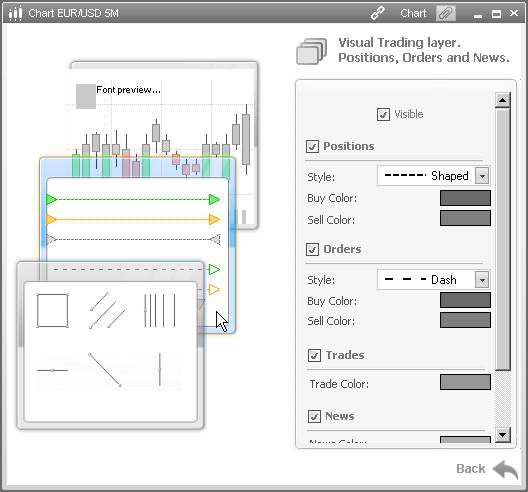
Figure 56: Visual Trading Layer Settings
- Visible: Toggles the Visual Trading Layer on and off.
- Positions: Specifies the visibility and appearance of open positions in the chart. Positions are represented as lines starting from when they are open and ending when they are closed. Check and uncheck the checkbox to show or hide positions. Choose a line style from the Style drop-down list. Choose colors for buy positions and sell positions by clicking the Buy Color and Sell Color boxes.
- Orders: Specifies the visibility and appearance of orders in the chart. Orders are represented as lines starting from when they are entered and ending when they are filled or canceled. Check and uncheck the checkbox to show or hide orders. Choose a line style from the Style drop-down list. Choose colors for buy orders and sell orders by clicking the Buy Color and Sell Color boxes.
- Trades: Specifies the visibility and color of event marker arrow for trades. Check and uncheck the checkbox to show or hide trades. Choose a color by clicking the Trade Color box.
- News: Specifies the visibility and color of event marker arrow for news. Check and uncheck the checkbox to show or hide news. Choose a color by clicking the News Color box.
- Closed Positions: Specifies the visibility and color of event marker arrow for closed positions. Check and uncheck the checkbox to show or hide closed positions. Choose a color by clicking the Color box.
When you finish, click Back to return to your chart.
6.8.3 Tools Layer Settings
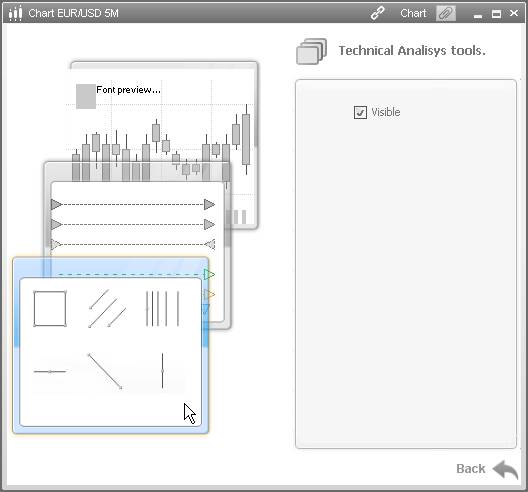
Figure 57: Analysis Tools Layer Settings
To determine whether or not the drawing tools and notations on your chart are visible, check or uncheck the Visible checkbox for the Tools layer.
see Drawing on Charts for more information about chart analysis tools.
When you finish, click Back to return to your chart.
6.8.4 Chart Types and Colors
To view and change the settings of the graph, right-click inside the chart and select View > Settings or click the Show Settings button in the lower right corner of the chart:
![]()
Click the main layer settings. The options in the main indicator view change depending on how your chart is set when you open the settings dialog.
- Chart Type: Specifies the type of the chart
- Bar Up Color: Specifies the color used to indicate price increase on Bar charts. To choose another color, click inside the color bar and choose the new color from the dialog.
- Bar Down Color: Specifies the color used to indicate price decrease on Bar charts. To choose another color, click inside the color bar and choose the new color from the dialog.
- Line Color: Specifies the color of graph line or candle outline and the indicator properties bar. To choose another color, click inside the color bar and choose the new color from the dialog.
- Solid color: Specifies the fill color of solid charts. To choose another color, click inside the color bar and choose the new color from the dialog.
When you finish, click OK to apply the changes and close the dialog box.
6.8.5 Track Cursor Settings
To access cursor tracking settings, do one of the following:
- Right-click inside the chart and select View > Settings and check the Track Cursor checkbox in Main Layer settings.
- Click the Show Settings toggle button in the lower right of the chart and check the Track Cursor checkbox in Main Layer settings.
![]()
Figure 58: Show Settings Toggle Button
- Check the Track Cursor checkbox in the Chart ribbon.
The following settings determine the appearance and behavior of the cursor in your charts:
- Stick to: Specifies at what price the cursor tracking indicator is placed in the time period:
- Open: The open price of the period
- Close: The close price of the period
- High: The high price of the period
- Low: The low price of the period
- Freehand: No sticking
- Show Price Line: Toggles appearance of a line in the price axis when cursor tracking is enabled.
- Show Time Line: Toggles appearance of a line in the time axis when cursor tracking is enabled.
6.9 Building Indicators
A collection of indicators is provided to assist you in technical analysis. The following indicators are available:
- 3MASignal (3 Moving Average Crosses Trade Signal)
- ADX (Average Direction Index)
- Alligator
- AMA (Adaptive Moving Average)
- Aroon (Aroon Night-Day Changes)
- AveTrueRange (Average True Range)
- Bollinger
- CCI (Commodity Channel Index)
- CMO (Change Momentum Oscillator)
- EMA (Exponential Moving Average)
- Envelope
- Ichimoku (Ichimoku Kinko Hyo)
- Keltner Channel
- LRI (Linear Regression Indicator)
- LWMA (Linear Weighted Moving Average)
- MACD (Moving Average Convergence/Divergence)
- MMA (Modified Moving Average)
- Momentum
- PO (Price Oscillator)
- Price Channel
- pSAR (Parabolic Stop and Reverse)
- PVI (Positive Volume Index)
- QStick
- ROC (Rate of Change)
- RSI (Relative Strength Index)
- SlowCStoch (Stochastic Slow Oscillator)
- SMA (Simple Moving Average)
- SMMA (Smoothed Moving Average)
- StdDev (Standard Deviation)
- Stoch (Stochastic Oscillator)
- Williams %R (Williams Percent Range)
To construct an indicator, right-click inside the chart and select Indicators > [desired indicator] or Indicator Lookup to choose an indicator from the Indicator Lookup window. In the [Indicator Name] Settings dialog box, click Parameters to specify the indicator parameters. When you finish, click OK.
6.9.1 Defining Indicator Appearance
When building an indicator, you can specify its line style, width and color in the Appearance screen of the [Indicator Name] Settings dialog box. To modify the appearance of the indicator afterwards, click the indicator's bar in the chart and select Indicator Settings. This opens the [Indicator Name] Settings dialog again to let you both change the appearance and edit the parameters of the indicator.
6.9.2 Hiding and Displaying Indicators
To hide or show an indicator, click the visibility toggle button in the indicator's bar in the chart.
6.9.3 Removing Indicators
To delete an indicator, click the close button in the indicator's button in the chart or click the button and choose Delete Indicator. Clicking the arrow of the New indicator button and selecting Indicators > Remove all indicators from instrument deletes all indicators from the chart.
6.10 Buy/Sell Price Tracking
Two markers along the price axis of a chart dynamically track the current buy price (green marker) and ask price (red marker). No matter where you scroll in the chart, you can always see the current market prices.
To show horizontal lines from the markers, either click a marker or right-click a marker and select Show price line.
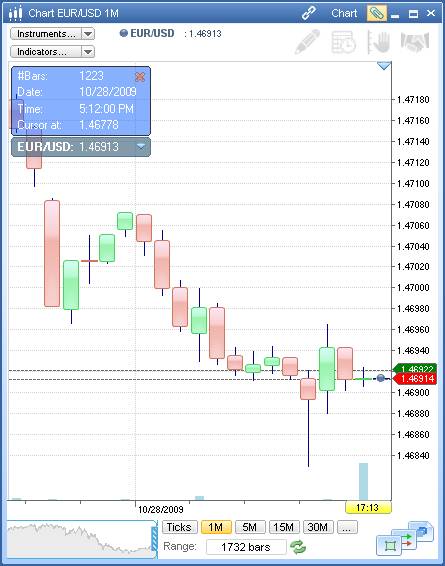
Figure 59: Buy/Sell Price Tracking
6.11 Cursor Tracking
When you turn cursor tracking on, the chart follows your mouse pointer interactively, showing exact values in the chart and allowing you to better analyze the data.
To turn on cursor tracking, do one of the following:
- Right-click inside the chart and select View > Settings and check the Track Cursor checkbox in Main Layer settings.
- Click the Show Settings toggle button in the lower right of the chart and check the Track Cursor checkbox in Main Layer settings.
![]()
Figure 60: Show Settings Toggle Button
- Check the Track Cursor checkbox in the Chart ribbon.
You can further configure cursor tracking to your needs. see Track Cursor Settings.

Figure 61: Cursor Tracking
6.12 Data Window
The Data Window is a special area on charts that displays all information pertinent to the current location of the cursor on the chart: number of bars, open, close, high, low, volume, time and date.
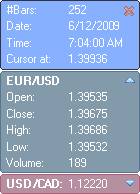
Figure 62: Chart Data Window
To display the Data Window, do one of the following:
- Right-click inside the chart and select View > Settings or click the Show Settings button in the lower right corner of the chart. Under Main Layer settings, check the Data Window checkbox.
- Check the Data Window checkbox in the Chart ribbon.
You can change the colors and fonts of the Data Window by right-clicking and selecting Colors or Font respectively, then making your desired selections in the dialog boxes that appear.
The Data Window may show the information for any indicators built on the chart (see Building Indicators). To show or hide indicator information, right-click the Data Window and click Indicators.
To move the Data Window within the chart panel, click anywhere on it and drag it to a new location.
To hide the Data Window, right-click inside it and choose Hide.
To close the Data window, click the X button in the top right.
6.13 Time Scale, Range, and Style
To choose a chart time scale, right-click inside the chart and select Interval > [desired time scale]. Alternatively, click one of the interval buttons (Ticks, 1M, 5M) at the bottom right of the Chart panel:
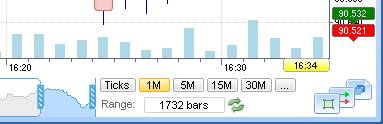
Figure 63: Chart Time Scale Tools
You can also specify a custom time scale by right-clicking inside the chart and select Interval > Custom... or clicking the View more periods button (...) and selecting Custom... from the menu. This opens the Custom Periods dialog.
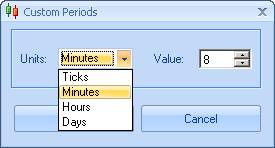
Figure 64: Chart Custom Periods Dialog
Select the units you want from the drop-down list and specify a value using the up and down arrows, or type the value. Click OK. The chart refreshes using the new time scale.
6.13.1 Chart Range
To change the number of datapoints in your chart, enter a new value in the Range field at the bottom of the chart panel. This range affects the amount of market data shown in the chart's scroll bar. see Zooming, Scrolling, and Refreshing. The Range field is visible only when you are not viewing historical data. see Charting Historical Data for more information.
6.13.2 Chart Styles
To choose a different chart style, do one of the following:
- Right-click inside the chart and select Style > [desired style]
- Click the Show Settings toggle button in the lower right of the chart and in Main Layer settings choose a new style from the Chart Style drop-down list.
![]()
Figure 65: Show Settings Toggle Button
- Click the drop-down list in the Chart ribbon.
For chart time-scales other than Tick by Tick, the available styles are:
Button |
Style |
|
Line |
|
Bar |
|
Candle |
|
Dot |
|
Dot Line |
|
Forest |
|
Solid |
6.14 Charting Historical Data
You can show specific date ranges of data in the chart. This allows you to analyze historical data.
To view historical data in the chart:
- Right-click the chart and select View > View History Data or click the View History Data button at the top right of the chart panel:
![]()
Two fields replace the Range field at the bottom of the chart.
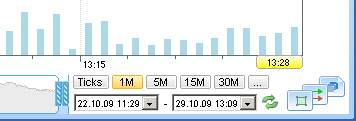
- Enter a begin date and time of the range in the left field or click the arrow to select a date from a calendar chooser.
- Enter an end date and time of the range in the right field or click the arrow to select a date from a calendar chooser.
- Click the Refresh button
 .
.
The chart refreshes to show the date range of data you specified.
6.15 Showing and Hiding Layers and Settings
A cluster of buttons in the lower right of the chart gives you quick access to functionality and chart settings.
![]()
Figure 66: Show/Hide Button Cluster
The Show/Hide Tool Layer button allows you to toggle the visibility of drawing, notation, and technical analysis in the chart
![]()
Figure 67: Show/Hide Tool Layer (Highlighted)
The Show/Hide Trading Layer button allows you to toggle the visibility of the trades, orders, positions, and news in the chart.
![]()
Figure 68: Show/Hide Trading Layer (Highlighted)
The Show Settings button replaces the chart in the panel with chart settings. see Chart Settings for more information.
![]()
Figure 69: Show Settings (Highlighted)
6.16 Volume Chart
You can display the trade volume as a bar chart along the horizontal axis of the chart.
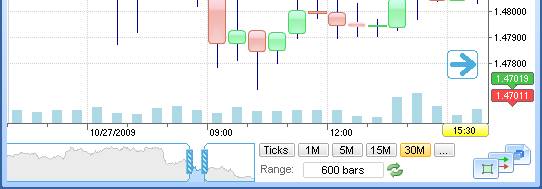
Figure 70: Volume Chart on Horizontal Axis of Chart
To display the volume chart, do one of the following:
- Right-click inside the chart and select View > Settings and check the Volume checkbox in Main Layer settings.
- Click the Show Settings toggle button in the lower right of the chart and check the Volume checkbox in Main Layer settings.
![]()
Figure 71: Show Settings Toggle Button
- Check the Volume checkbox in the Chart ribbon.
Back to BNFX - An Integral Power Trader Forex Broker
Power Trader is a product of Integral Development Corp., licensed and customised for BNFX Capital Ltd. All rights reserved.
RISK WARNING: Forex trading involves risk of loss and may not be suitable for all investors.