4.1 Chart Panel
Chart panels display the time charts for specific instruments. This is also where you build technical analysis indicators.
To open a new Chart panel, click New Chart in the Chart ribbon.
The following figure shows a snapshot of a chart panel displaying the 1-minute Candle chart for EUR/USD, with Data Window and volume chart shown, and cursor tracking enabled. The chart also shows an open position in EUR/USD (green line) and a MACD indicator.

Figure 13: Chart Panel Overview
To change the instrument displayed in the chart, right-click inside the chart and select Instruments > Instruments Lookup to choose a new instrument or group for the chart.
You can show graphs for multiple symbols in a single chart panel. see Showing Multiple Graphs on a Chart.
see Working with Charts for more information about using charts.
TIP: Click a symbol in any panel and drag it on the Chart panel to change the chart to that instrument.
4.2 Watchlist Panel
The Watchlist panel displays real time market data for each instrument available from your Broker.
To open a new Watchlist panel, click Watchlist in the Trading ribbon.
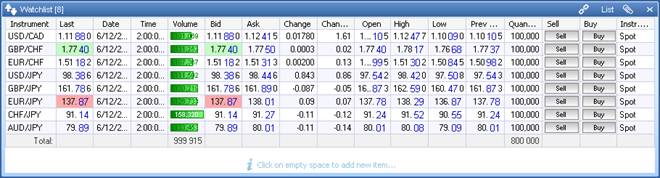
Figure 14: Watchlist Panel (List View)
If the new price or volume received is higher than the previous, the cell highlights in green; if the value goes lower, the cell highlights in pink. You can customize these colors (see Customizing Tables).
4.2.1 What You Can Do in the Watchlist
Right-click the Watchlist to display a shortcut menu you can use to add or remove symbols from the Watchlist, add new symbols to the Watchlist, add a symbol to favorites, export and import symbols to and from files, and add indicators to the Watchlist. You can also link the Watchlist to other panels (see Linking Panels).
TIP: When you add an indicator, a new column appears in the Watchlist, displaying the dynamically updated values for that indicator. Use the Trigger Manager to compare this column to another column or columns and thus build a simple trading strategy (see Using the Trigger Manager).
4.2.2 Using the Board View
The Watchlist panel is also available in a board view for easy one-click trading. To switch to the board view, click Board in the panel's title bar.
The color of the cells and the direction of the arrows shows the change against the previous day's close: red/down if the price went lower, green/up if the price went higher.
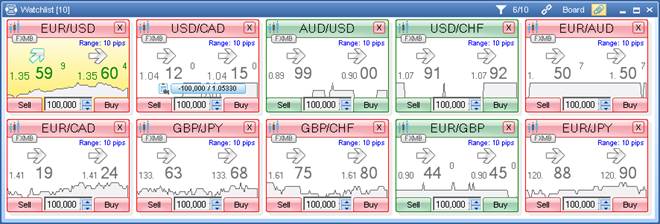
Figure 15: Watchlist Panel (Board View)
In addition to the features described above, in a board-based Watchlist you can quickly place market orders (see Placing Market Orders). To view the chart for an instrument, click the chart icon in the top left corner. To close a cell, click the X button in the top right corner.
You can also customize the colors for the FX Cells. see FX Cell Colors for details.
4.2.3 Market Range
Each FX Cell indicates the defined Market Range. When the Market moves beyond the defined market range, the trade does not go through and Power Trader displays the Market Price [n] is out of range [n – n+] message. The default range is set in the Administrator's Console.
4.3 FX Board
An FX Board is essentially a Watchlist panel in a board view. see Watchlist Panel.
4.4 Instruments Lookup Panel
The Instruments Lookup panel shows the list of instruments available from your Broker, add an instrument to a Chart or Watchlist panel, and allows you to define your own instrument groups.
To open a new Instruments Lookup panel:
- From a Chart panel showing one instrument, click the instrument at the top of the panel.
- From a Chart or Watchlist panel, right-click the panel and select Instruments > Instruments Lookup.
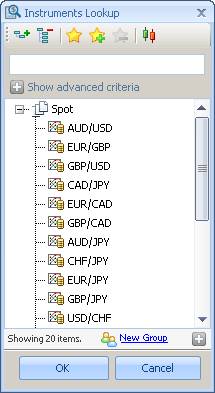
Figure 16: Instruments Lookup Panel
To either switch the Chart panel to show the graph for an instrument or group, or to add an instrument to the Watchlist panel, double-click an item in the list.
4.5 Favorites
When working with a large number of instruments, consider adding the ones you use most often to Favorites so you can quickly add them to the Watchlist panel (Watchlist Panel) or select them in the Order Entry panel (Order Entry Panel). To add an instrument to Favorites, right-click on it and select Add to favorites or click the Add to Favorites button in the toolbar. To view your list of favorite instruments, right click the list and select Show only favorites or click the Show Only Favorites button in the toolbar.
4.6 Search
To search the instruments, enter your search criteria in the field at the top of the panel. The list updates dynamically as you type.
4.7 Quotes History Panel
The Quotes History panel displays the entire stream of incoming quotes received by Power Trader, indicating their time accurate to the thousandths of a second.
To open a new Quotes History panel for all instruments, select Add Panel > Quotes History. To open the Quotes History for a specific instrument, right-click inside the chart for this instrument or on any table entry pertaining to this instrument and select New > Quotes History.
When displaying quotes for all instruments, the Quotes History can display tick by tick quotes only. When used for a single instrument, you can select any other time scale. To do this, click the Quotes History and select BNFX Button > Settings. In the Quotes History Settings dialog box, click against Time Scale and select a new time scale from the list.
You can use the same dialog box to change the default maximum row count in the panel. By default, it is 200.
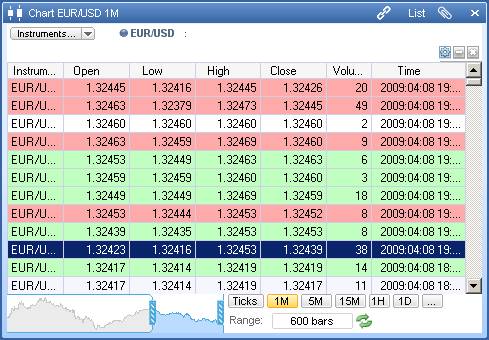
Figure 20: Quotes History Panel
You can clear the Quotes History of all entries by right-clicking and selecting Clear All. New quotes will appear in the panel shortly.
You can view the Quotes History as a chart by clicking the Chart button near the top right corner of the panel.
TIP: Because the Quotes History panel displays the quotes either for all instruments or just one, you need to apply a filter to watch several instruments in one panel (see Filtering Entries Using the Filter Manager).
4.8 Positions Panel
The Positions panel lists the positions you currently have open. Whenever a new position is open, it immediately appears in this panel.
To open a new Positions panel, click Positions in the Trading ribbon.
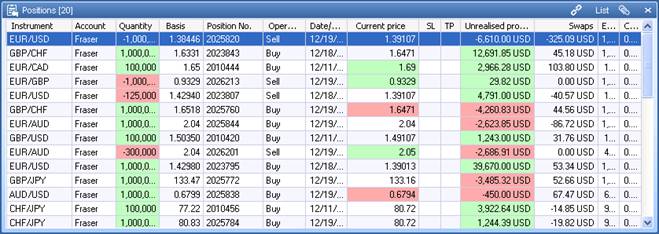
Figure 23: Positions Panel (List View)
For each position, the following information is available:
- Instrument: The name of the instrument traded.
- Account: The user name of the account that opened the position.
- Quantity: The amount of the position, in lots of units depending on what is selected in the Settings dialog box.
- Basis: The price at which the position was opened.
- Position No.: The unique number assigned to the position by Power Trader.
- Operation: The operation with which the position was opened (SELL or BUY).
- Date/Time: The date and time the position was open.
- Current price: The market price received from your broker.
- Amount Exp1: The amount of the trade in base currency terms.*
- Amount Exp2: The amount of the trade in counter currency terms.*
- SL: The stop loss price set for the position, if any.
- TP: The take profit price set for the position, if any.
- Amount Exp1/cl: The amount required to close a position, in base currency terms (the inverse of Amount Exp1).*
- Amount Exp2/cl: The amount required to close a position, in counter currency terms (the inverse of Amount Exp2).*
- Profit Exp2: The profit or loss in contract currency terms, calculated based on current broker's price (shows profit or loss you would make if you close the position at the current price).*
- Profit: The profit or loss in your account currency, calculated based on current broker's price (shows profit or loss you would make if you close the position at the current price).
- Swaps: The amounts collected or paid out by your broker when you roll a position over to a new value date.
- Exposure: The amount of your exposure in a position in the account currency.
* Columns marked with an asterisk (*) are not visible by default. To display additional columns, right-click any of the column headers and click the title of the column you want in the shortcut menu. Use the same procedure to hide the columns you do not need. You can also use the Columns Manager to select the columns to display and configure them (see Using the Columns Manager).
TIP: As an alternative to having all or too many columns displayed, you can right-click on the position and select View > Details. A new panel will open containing all details of the position. This feature is also available in all other panels.
4.8.1 Display Profits Graphically
You can graphically display the Profit figure by right clicking on the panel column header and using the Column Manager feature as shown below.
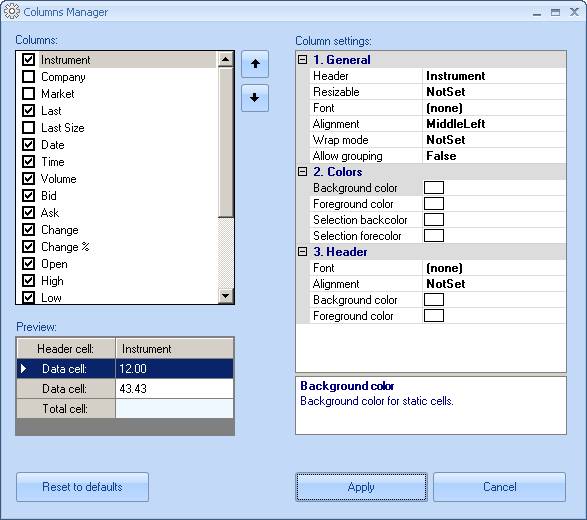
Figure 24: Column Manager
4.8.3 What You Can Do in the Positions Panel
Right-click on a position in the panel to display a shortcut menu you can use to close the position (Closing a Position), close all positions (Close All Positions), close a part of the position (Closing a Position Partially), mutually close multiple opposite positions (Closing Opposite Positions), and set or remove a stop loss or take profit price for the position (Using Stop Loss and Take Profit Prices).
You can also link the Positions panel to other panels (see Linking Panels).
TIP: Double-click a position to close it.
4.8.4 Using the Board View
The Positions panel is also available in a board view for one-click trading. To switch to the board view, click Board in the panel's title bar.
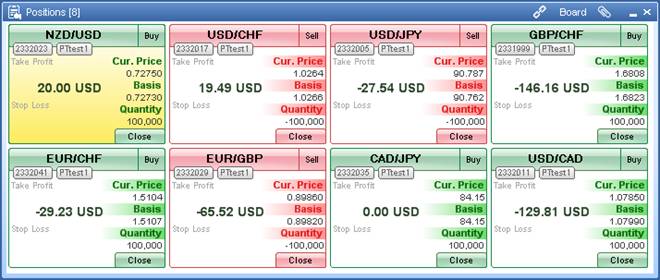
Figure 26: Positions Panel (Board View)
Each position cell provides much the same information as the default columns in the list view. From each cell, you can close a position (Closing a Position) or close a part of the position (Closing a Position Partially).
4.8.5 Close All Positions
In the Positions panel, when you close all positions, the following panel appears giving options on which positions need to be closed.
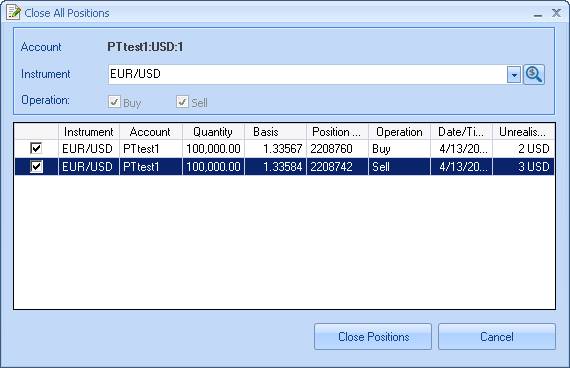
Figure 27: Close All Positions Dialog
4.9 Orders Panel
The Orders panel shows your pending orders. When filled, the order disappears from this panel.
To open a new Orders panel, select Orders from the Trading ribbon.
The Orders panel can display either your open orders only (orders you place to open new positions) or both open and close (stop loss and take profit) orders. To display close orders, right-click the panel and select Show Close Orders (SL/TP) on top of the shortcut menu.
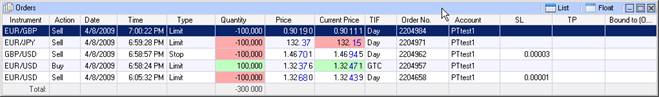
Figure 28: Orders Panel (List View)
For each pending order, the panel shows the following information:
- Symbol: The name of the instrument traded.
- Action: The type of trade to be executed (SELL or BUY).
- Date: Date the order was placed.
- Time: The time the order was placed.
- Type: The order type.
- Quantity: The amount of the order, in base currency units. (100,000 = 1 Standard Lot; 1,000 = 0.01 Lot or 1 Micro Lot which may or may not be available depending on your account type)
- Price: The price at which the order will be executed.
- Current price: The market price received from your Broker.
- TIF: The order's time in force.*
- Order No.: A unique number the trading system assigns to each order. A position opened with this order will have the same number.
- Account: The user name of the account that opened the order.
- SL: The stop loss price set for the order, if any.
- TP: The take profit price set for the order, if any.
- Bound to (OCO): The number of the order bound to the current one. If the bound order is executed, the system cancels the current one.
* Columns marked with an asterisk (*) are not visible by default. To display additional columns, right-click any of the column headers and click the title of the column you want in the shortcut menu. Use the same procedure to hide the columns you do not need. You can also use the Columns Manager to select the columns to display and configure them (see Using the Columns Manager).
4.9.1 What You Can Do in the Orders Panel
Right-click the Orders panel to display a shortcut menu you can use to modify the order (Modifying a Pending Order), cancel a single order or all orders in an instrument or in an account (Canceling Pending Orders), and set or remove a stop loss or take profit price for the order (Using Stop Loss and Take Profit Prices).
You can also link the Orders panel to other panels (see Linking Panels).
TIP: Double-click an order to cancel it.
4.9.2 Using the Board View
The Orders panel is also available in a board view for easy one-click trading. To switch to the board view, click Board in the panel's title bar.
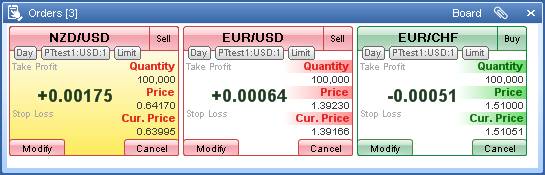
Figure 29: Orders Panel (Board View)
Each order cell provides the same information as the columns in the list view. From each cell, you can modify the order (Modifying a Pending Order) or cancel the order (Canceling Pending Orders).
4.10 Order Entry Panel
Use the Order Entry panel to place market or pending orders.
To open a new Order Entry panel, click Order Entry in the Trading ribbon.
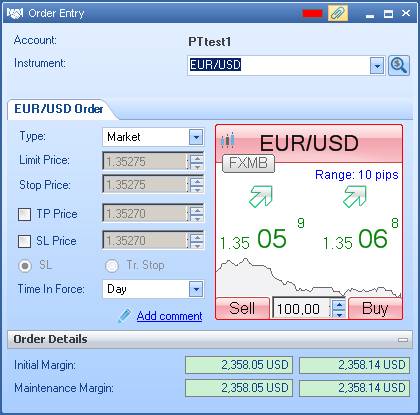
Figure 30: Order Entry Panel
You can also customize the colors for the FX Cells. see FX Cell Colors for details.
4.10.1 Market Range
Each FX Cell indicates the defined market range. When the market moves beyond the defined market range, the trade does not go through and Power Trader displays the Market Price [n] is out of range [n - n+] message.
4.10.2 Placing Market or Pending Orders
For a description of how to use the Order Entry panel, see Placing Market Orders and Placing Pending Orders
4.11 Order Book Panel
The Order Book panel shows system actions pertaining to your orders, both open and close (SL/TP): creation, modification, removal, and execution. The information in the Order Book pertains to the current session only.
To open a new Order Book panel, click Order Book in the Trading ribbon.
You can clear the panel contents by right-clicking the table in the panel and selecting Clear Table from the context menu.

Figure 31: Order Book Panel
4.12 Account Summary Panel
The Account Summary panel shows the basic details of your account.
To open a new Account Summary panel, select Account(s) from the Trading ribbon.
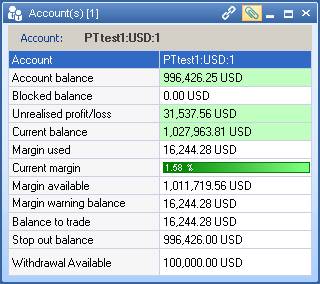
Figure 32: Account Summary Panel
The Account Summary panel shows the following information about your account:
- Account: Account name
- Account balance: Your account balance in USD
- Blocked balance : That portion of your balance that is not available at this time
- Unrealised Profit/Loss: Your profit or loss in USD on all currently open positions, recalculated in real time based on most recent quotes
- Current balance: Your account balance adjusted for open positions, in USD. Shows what the balance would be if all open positions are closed at current prices
- Margin used: Total margin used
- Current Margin: Total margin used shown as a percentage of your total margin
- Margin available: Total margin available
- Margin warning balance: Level of margin when Margin Call will be applied
- Balance to trade: Margin available for trading
- Stop out balance: Stop out amount
- Withdrawal Available: Funds available for withdrawal
TIP: You can configure the status bar to display the values of up to three columns of the Account Summary panel at all times (see Configuring the Status Bar).
4.13 Positions Balance Panel
The Positions Balance panel shows a summary of your open positions in each instrument.
To open a new Positions Balance panel, click Positions Balance in the Trading ribbon.

Figure 33: Positions Balance Panel (List View)
For each instrument in which you have open positions, the following information is available. Right-click the heading row to configure the columns shown in the list view.
- Instrument: The instrument
- Net amount: Your net holdings
- Aver. price: The average price for all positions in the instrument
- Current price: The current price in the market
- Profit: Profit or loss of your positions the instrument would yield if closed at current prices
- Buy: A total of your buy positions
- Average Buy: The average buying price
- Sell: A total of your sell positions
- Average Sell: The average selling price
- Gross Exposure: A total of outstanding open positions in the instrument
- Net Exposure: The net exposure of open positions
- Pending Buy orders: The number of pending buy orders in the system for the instrument
- Pending Sell Orders: The number of pending sell orders in the system for the instrument
- Margin used: The total margin used
The Positions Balance panel is also available in a chart view for better visual presentation. To switch to the chart view, click List in the panel's title bar and choose Chart.
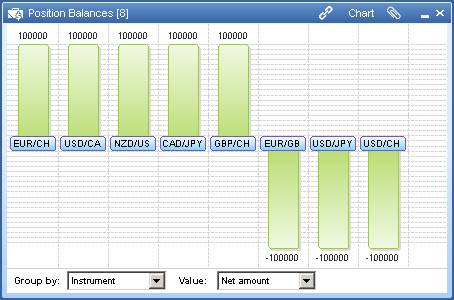
Figure 34: Positions Balance Panel (Chart View)
You can choose from following information to chart in the Value drop-down list:
- Net amount: Your net holdings
- Aver. price: The average price for all positions in the instrument
- Current price: The current price in the market
- Unrealized profit/loss: Profit or loss of your positions the instrument would yield if closed at current prices
- Buy: A total of your buy positions
- Average Buy: The average buying price
- Sell: A total of your sell positions
- Average Sell: The average selling price
- Gross Exposure: A total of outstanding open positions in the instrument
- Net Exposure: The net exposure of open positions
- Pending Buy orders: The number of pending buy orders in the system for the instrument
- Pending Sell Orders: The number of pending sell orders in the system for the instrument
- Margin used: The total margin used
4.14 Currencies Exposure Panel
The Currencies Exposure panel shows a summary of the currencies in which you have open positions. The Amount column shows your total holdings of the currency shown in the Currency column.
To open a new Exposure panel, click Currencies Exposure in the Trading ribbon.
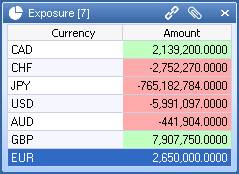
Figure 35: Exposure Panel
4.15 Event Log Panel
The Event Log panel shows the log of events that occurred during your session.
To open a new Event Log panel, click Event Log in the Trading ribbon.
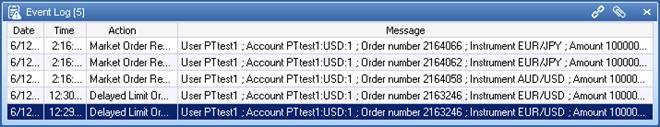
Figure 36: Event Log Panel
Power Trader makes an entry in the log file each time you open or close a position, or you create, modify, or remove a pending order (including SL and TP). Each log entry indicates the action, the instrument traded, type of operation, trade or order price, amount of trade or order, order number and the time of the event. Entries are also made whenever you connect to or disconnect from the server.
Back to BNFX - An Integral Power Trader Forex Broker
Power Trader is a product of Integral Development Corp., licensed and customised for BNFX Capital Ltd. All rights reserved.
RISK WARNING: Forex trading involves risk of loss and may not be suitable for all investors.